
Eager students at the Tromsø hub assessing each other’s XRF data. Clockwise from left: Anne Paavilainen, Christine Tømmervik Kollsgård, Max Holthuis Julie Velle, and Carmen Braun.
While it is possible to directly measure parameters related to the climate of today, we cannot do so for the past. In order to reconstruct paleoclimate, we rely on multiple different methods to indirectly investigate past conditions. One tool in the paleoclimate toolbox is x-ray fluorescence (XRF) core scanning.
The physical XRF workshop planned originally was postponed, but a hybrid workshop eventually took place at the end of September (27-29). Of 12 participants, 7 joined physically at the Tromsø-hub and 5 joined virtually, and more than 20 more CHESS-members accessed the live stream we offered. The workshop gave scientists and students who work on XRF data the chance to meet.
During the workshop, we were introduced to XRF as a tool for paleoclimate reconstructions in the Arctic, how to interpret XRF data, and how to use the software Xelerate. There are several different XRF core scanners, so Eivind Wilhelm Nagel Støren introduced us to the ITRAX core scanner and Karina Monsen, the Avaatech core scanner. Christian März gave a lecture on biogeochemical processes that can affect the XRF results and their interpretation. Additionally, Cristoph Vogt gave a lecture about a core from the Lomonosov Ridge to show how the study of this core has changed over time. Rik Tjallingii showed us how Xelerate can be helpful when choosing relevant element-ratios to study from a data set. He gave us an introduction to XRF-statistics and how to use Xelerate before helping all participants download and study their data.
On the last day, students worked on their own data and presented their outcomes to the rest of the group. Christoph Vogt and Rik Tjallingii gave great feedback and tips that we are very grateful for! We look forward to continuing these discussions in the future and we hope this was just the start of many XRF-workshops to come.
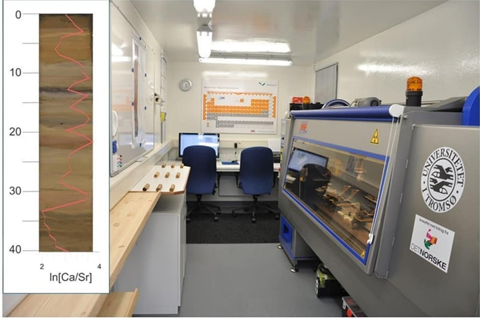
The Avaatech core scanner in the shipping container (so it can be taken to sea on research cruises) at UiT, with an inset graph of XRF results over a core photo.
Photos by Vårin Trælvik Eilertsen
Text by Vårin Trælvik Eilertsen, Christine Tømmervik Kollsgård, and Carmen Braun.
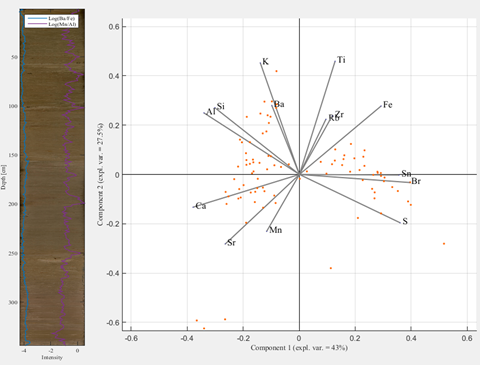
Data displayed using the Xelerate software. Left: ratios of relevant elements plotted on top of sediment core photo. Right: Biplot of relevant elements from the studied core section.